
When people are asked to define a “financial report”, many would answer that a financial report is ‘a table with numbers’. Financial reports are very often associated with Microsoft Excel since we live in a world where you can export almost anything into MS Excel and knowledge of MS Office is considered a de facto basic skill for any employee. For this reason, the words ‘financial report’ has become a synonym of an Excel sheet. However, employees who have already faced implementation of a new data strategy in their organization or introduction of new business intelligence concepts in their work would say that a report is a visual representation of information with charts and graphs, rather than just a table with figures.
Then, what is Dashboard? An Oxford dictionary says that it is ‘the panel facing the driver of a vehicle or the pilot of an aircraft, containing instruments and controls (Oxford University Press, n.d.).’ At first sight, it sounds confusing in our context, doesn’t it? Nevertheless, imagine that you are driving a car, and you are sitting in front of the driver’s dashboard. But your car is more than an ordinary vehicle – it is the entire organization where you are working. What would you place on this dashboard? What measures the health and growth of your company and is vital for a safe ‘road trip’? What KPIs are important for your team leader or head of the department?
In the diverse variety of business intelligence tools available on the software market, a report can be defined differently. However, Dashboard has always been serving one main purpose: to represent KPIs via gauges, tiles with big numbers, intuitively understandable trends, etc. In this article, we will look at similar features of reports and dashboards in Power BI and discuss their distinctions.
Report in Power BI
Each Power BI Desktop file (file with ‘pbix’ extension) represents one report. At the same time, you may see that in Power BI Desktop you can have multiple tabs or, according to the Microsoft terminology, pages. On top of that, each of the pages may contain several visuals (see common visual examples here: Visualization types in Power BI).
Let’s consider, for instance, a sample Microsoft Power BI file which you can download from Microsoft GitHub account by using this link or from the attachment to this article:
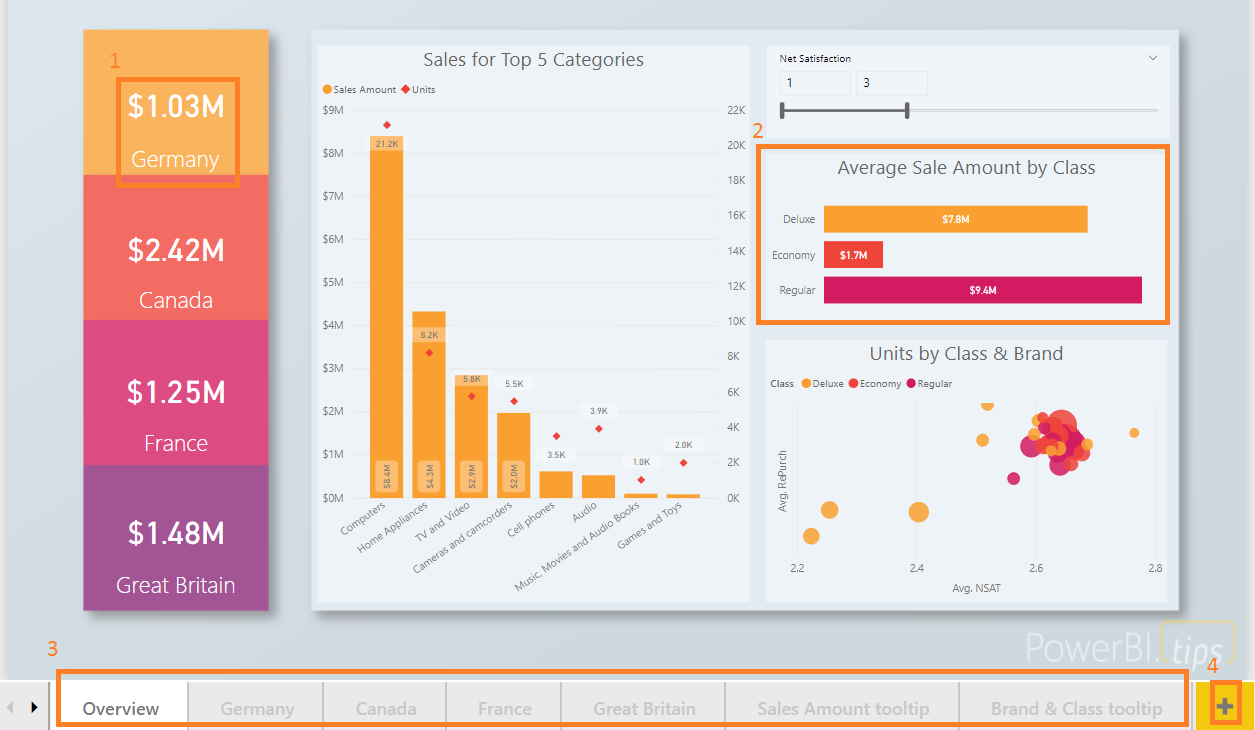
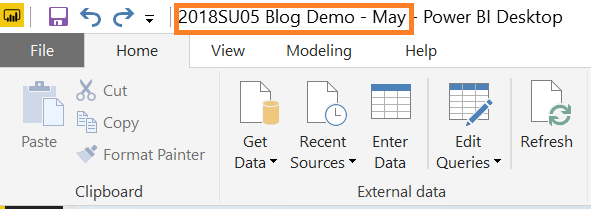
On the picture above, we can see that ‘1’ and ‘2’ are visuals located on the ‘Overview’ page. At the same time, ‘Overview’, ‘Germany’, ‘Canada’ and other tabs on the bottom – ‘3’ – represent Power BI pages. All the pages are parts of one report associated with the file – 2018SU05 Blog Demo – May.pbix:
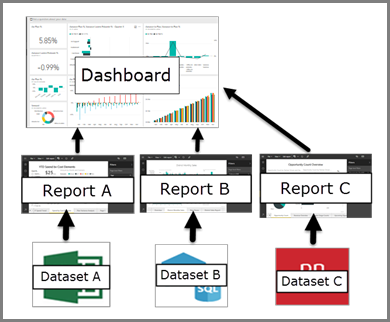
Overall, the relationship between visuals, pages, report and ‘pbix’ file looks like this:
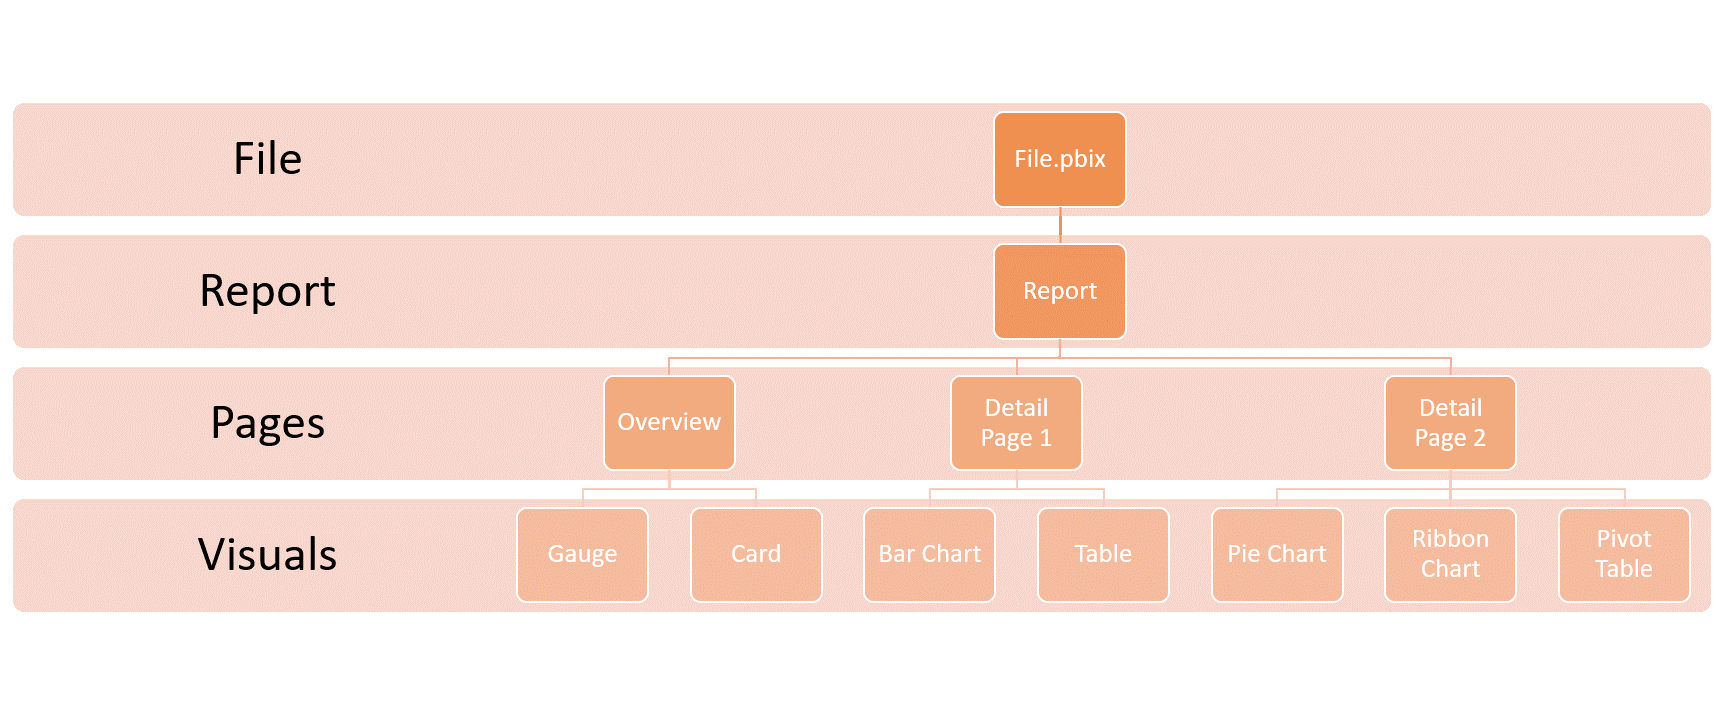
Visual types, pages, report and file names are given as examples. In reality, you are not required to create an Overview page as the first one and detailed pages as the second one; although, it is considered to be a good approach to tell your data story starting from general information and then going deeper into details. Also, you can choose any number of visuals having diverse types for any page of your report.
Dashboard in Power BI
A dashboard can be combined from one or several Power BI reports. However, this doesn’t mean that a dashboard should contain all the visuals from all the pages of a report. Instead, you define one-by-one each visual of the report to be included into Power BI Dashboard. I’d like to emphasize that – usually, you are not choosing the whole page of a report to be included, but a particular visual from a particular page. However, the ability to pin the entire report page to a dashboard also exists.
Furthermore, it is worth mentioning that if you are using Power BI Report Server – on-premises version of Power BI – you cannot create Power BI dashboards. Similarly, you cannot create a dashboard in Power BI Desktop: Power BI service (app.powerbi.com) is the only place where dashboard can live (at least, it is so at the moment of writing this article).
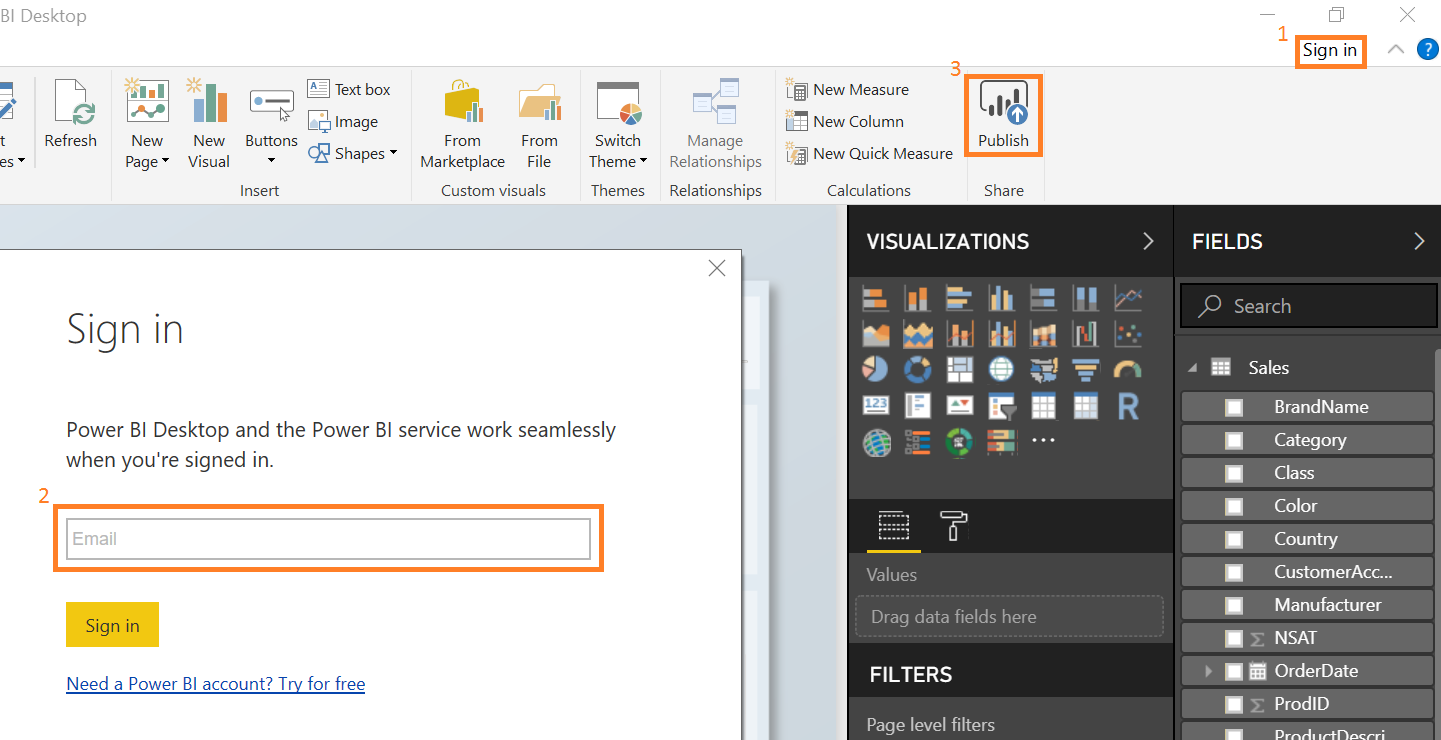
To create a simple dashboard, you need to publish your Power BI report to Power BI service. Let’s do this with our sample file that we used in the previous section. Sign-in to your Power BI account and click on ‘publish:’
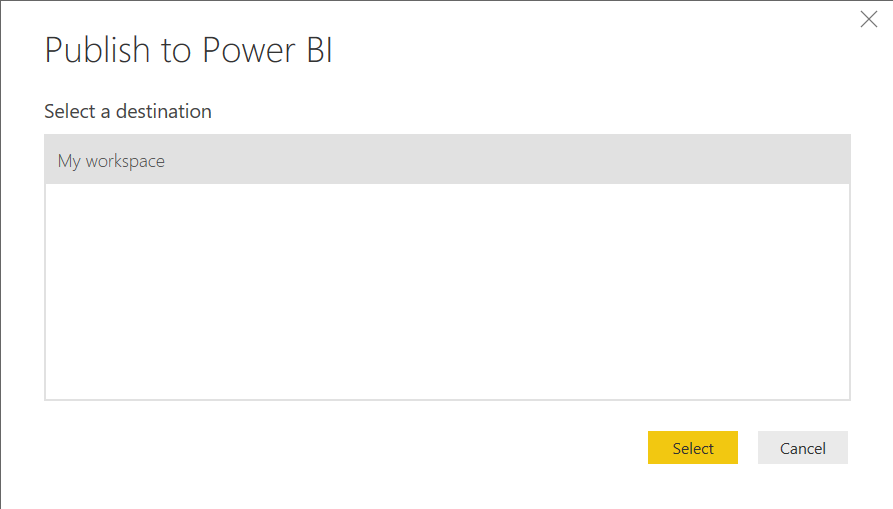
You can choose any workspace you have, for example, your personal workspace ‘My workspace’:
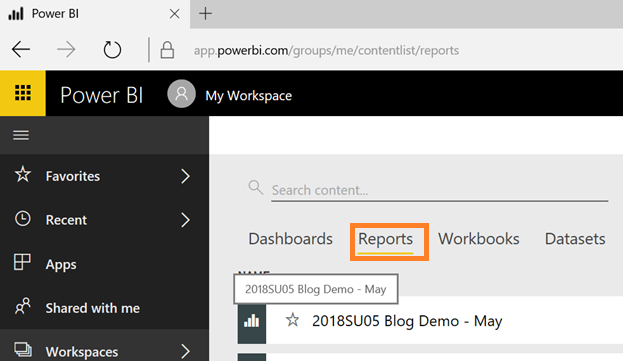
Once the report is published, navigate to the ‘reports’ tab in your workspace in Power BI online service:
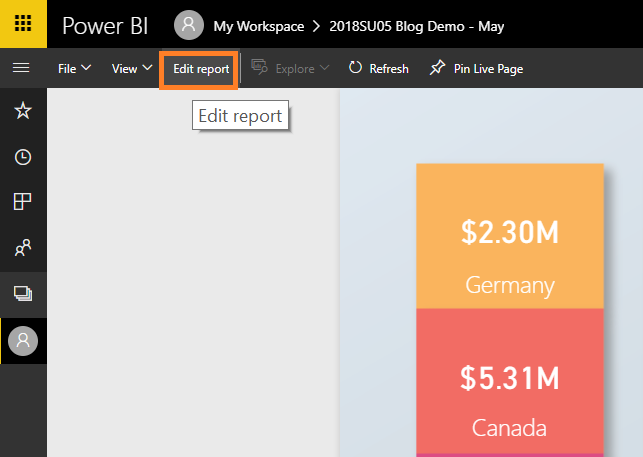
Then, click on ‘edit report:’
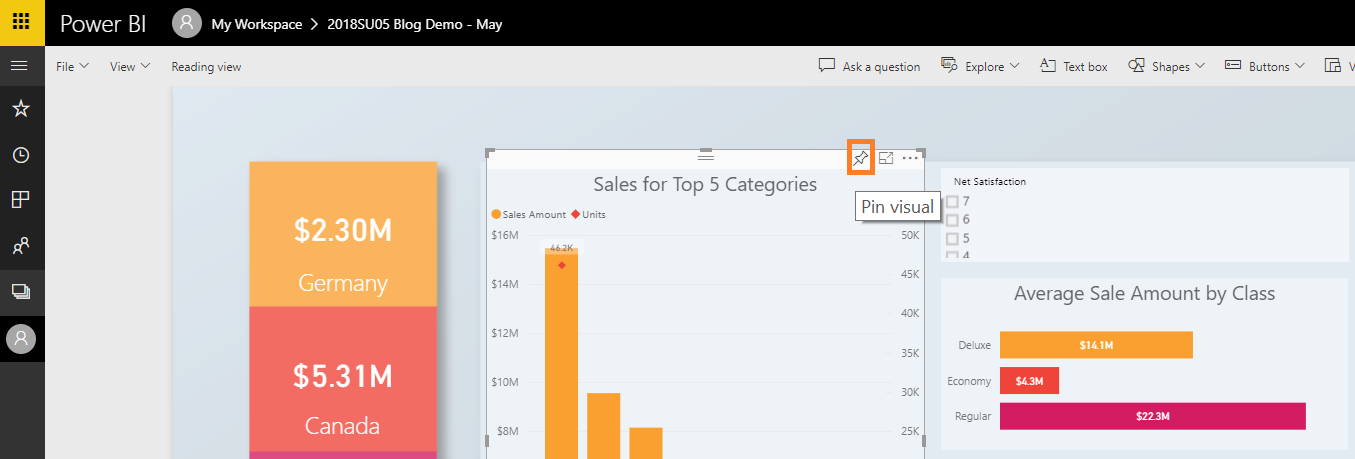
Now, you can add your visual to a dashboard. Click on any visual and then, on the top of the visual, click on ‘Pin visual’:
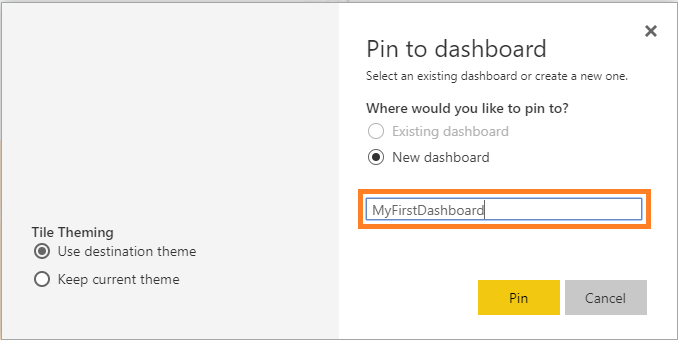
You will need to provide a name for a dashboard:
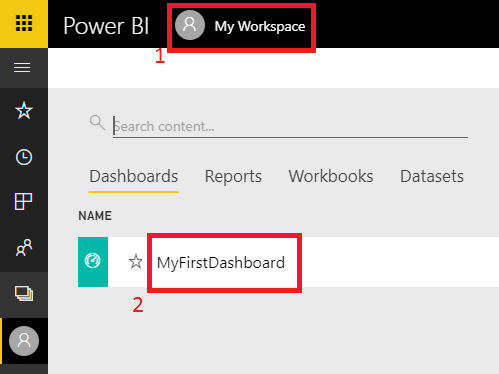
Do this for several visuals from different pages. Choose any visuals you like. Finally, click on ‘My Workspace’ on the top and then on your newly created dashboard:
By dragging and dropping, you may rearrange your dashboard tiles:
If you click on any tile on the dashboard, you will be redirected to the report page containing this visual.
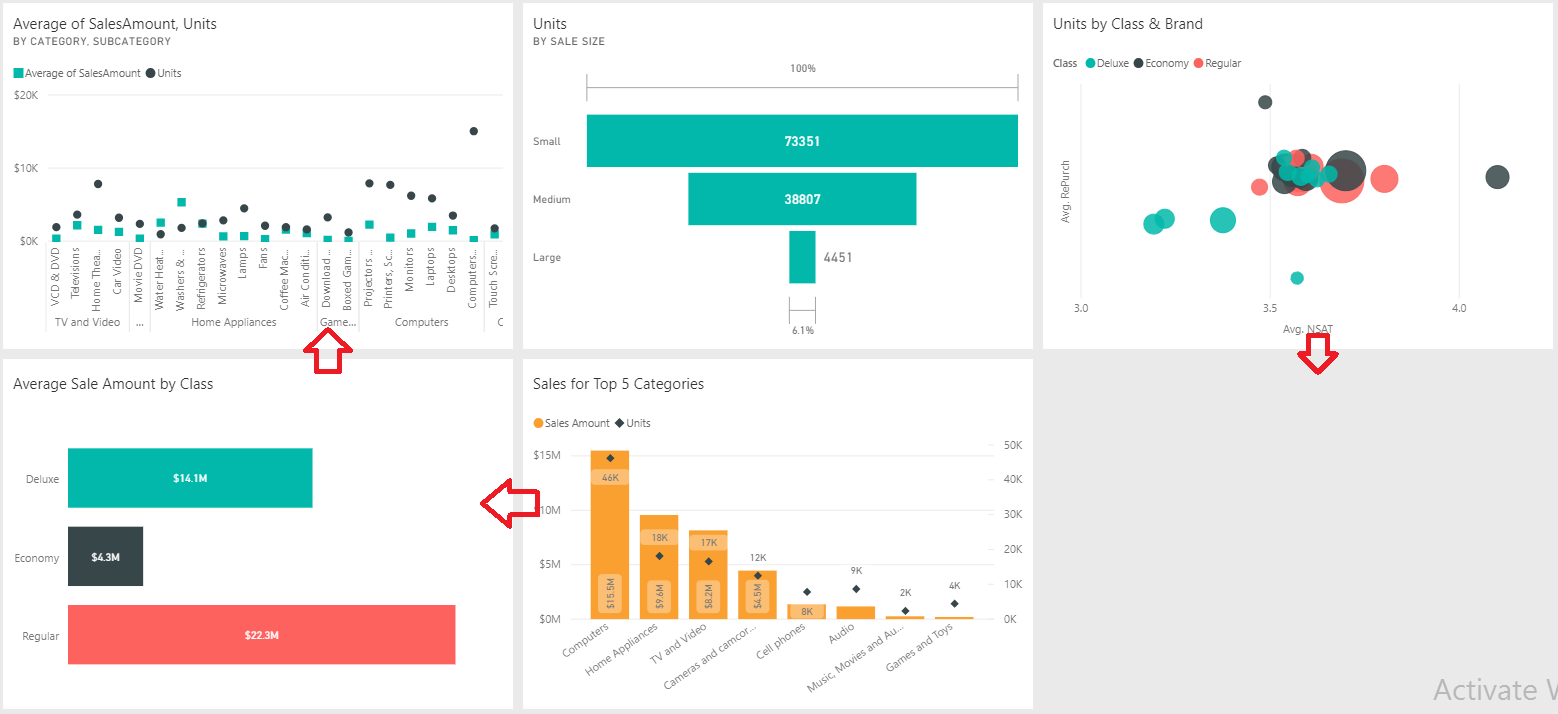
Please note that you may add visuals from different reports into one dashboard:
(Microsoft, n.d.)
The example above, basically, shows how dashboards work: you may consume the key information, but you are not supposed to interact with visuals on the dashboard. A dashboard may be thought about as a homepage of a website – in this case, your analytical website. This page serves as a summary of your analytical content and an entryway to your reports. Overall, having a dashboard is important for a natural navigation flow which should start from summarized information and allow going into detail where required.
Dashboards vs Reports
For a beginner, Power BI reports and dashboards often seem to be something very similar. Indeed, the difference may be only felt after you have created a couple of reports with several visuals and have been utilizing them for several weeks. Nevertheless, let’s consider key differences below.
Firstly, you can create the dashboard only in Power BI service rather than in Power BI Desktop, whereas reports can be created and utilized in both Power BI Desktop and Power BI Service. Additionally, you cannot create a dashboard in Power BI Report Server. Secondly, a dashboard always has one page with content that cannot be filtered or sliced, while a report can have one or many fully interactive pages. In general, there is a plenty of customizations available in a report view and not available for dashboard customization.
You need a report: when you need to actively consume information via interaction, slicing and dicing, drilling down and up while looking for trends, dependencies and their underlying causes. You are supposed to use reports to explore your data.
You need a dashboard: when you have many reports with many pages and you need an entry point for data consumption and a brief summary of contents on one canvas.
What Happens In Practice
In practice, BI teams do not always use both dashboards and reports even in Power BI Service (Power BI online). You cannot create content in Power BI software without designing a report, but you can create and consume visuals without dashboard(s). Also, many Power BI users say that they are using Power BI dashboards while they are actually interacting only with Power BI reports: for a Power BI rookie any individual page of a report looks identical to a dashboard.
To sum up, if you have several reports with many pages, it makes sense to render the most critical information on a dashboard: the dashboard will serve as a landing page for your analytical portal: by clicking on any tile on the dashboard a user is being navigated to the page of the report containing the visual from the tile clicked. However, you can always achieve similar functionality by creating a summary report page with buttons and bookmarks, but the process would become more difficult and complicated. The essence is that dashboards are created for static observations, whereas reports are designed for a highly interactive experience. Usually, you naturally start building dashboards when you come to realize that you have too many reports confusing you and your management.
References
Microsoft. (n.d.). Dashboards in Power BI service. Retrieved from https://docs.microsoft.com/en-us/power-bi/service-dashboards
Microsoft. (n.d.). Reports in Power BI. Retrieved from https://docs.microsoft.com/en-us/power-bi/service-reports
Oxford University Press. (n.d.). Definition of dashboard in English. Retrieved from https://en.oxforddictionaries.com/definition/dashboard