Every model should have a Date table. We will see what this means in this tutorial.
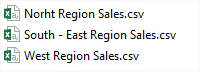
Let suppose that we have to visualize the data of a store with several branches across the country. We have three files grouped in regions:
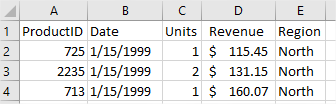
The file structure is simple, with ProductID, Date, Units, Revenue and the Region:
Let’s load these files into Power BI Desktop. We see that we have same file structure:
Now, let’s suppose we want to visualize Sales by Date for all the regions.
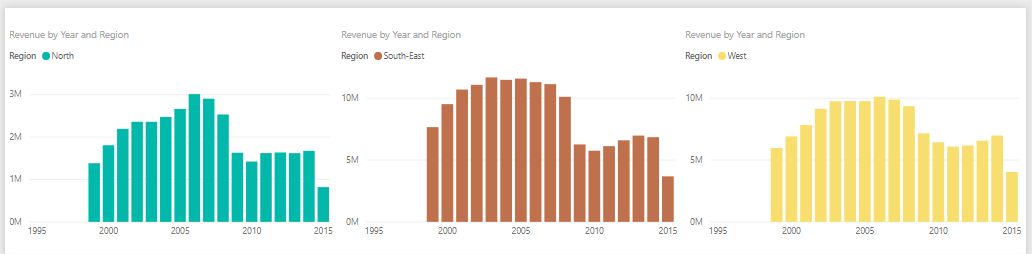
So far so good, we have created three column chart visuals that show Sales by date.
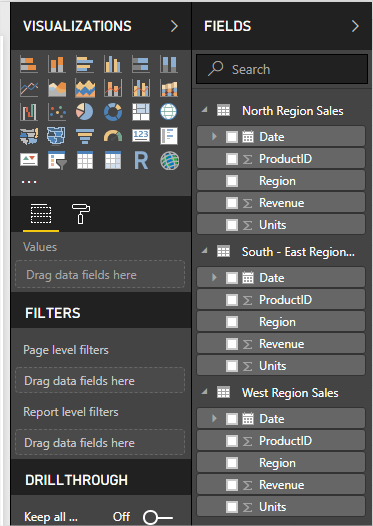
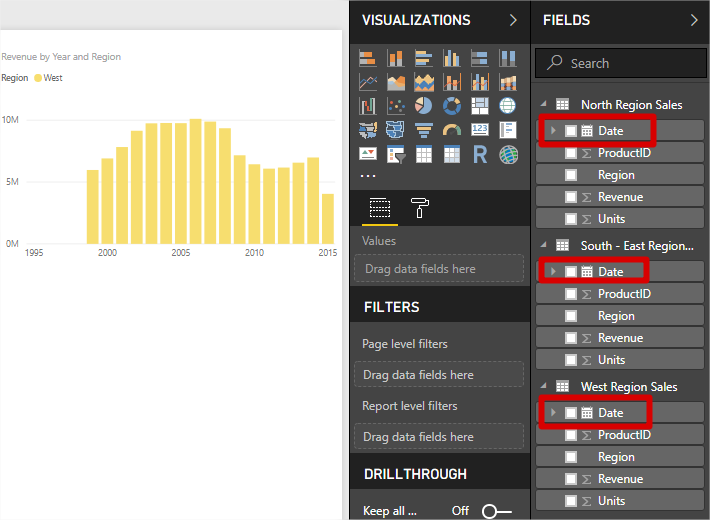
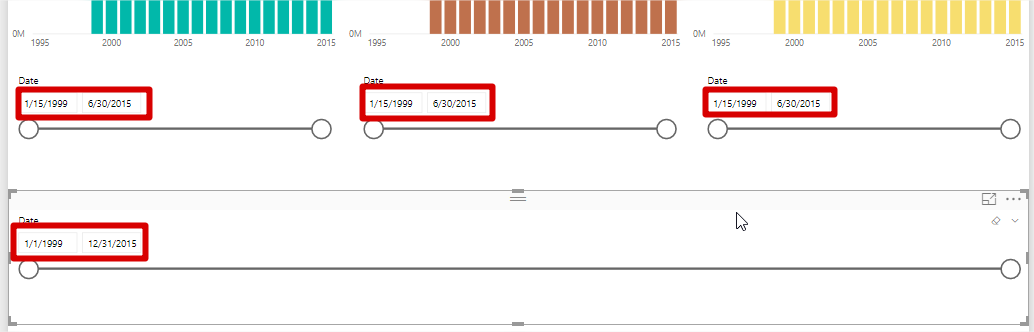
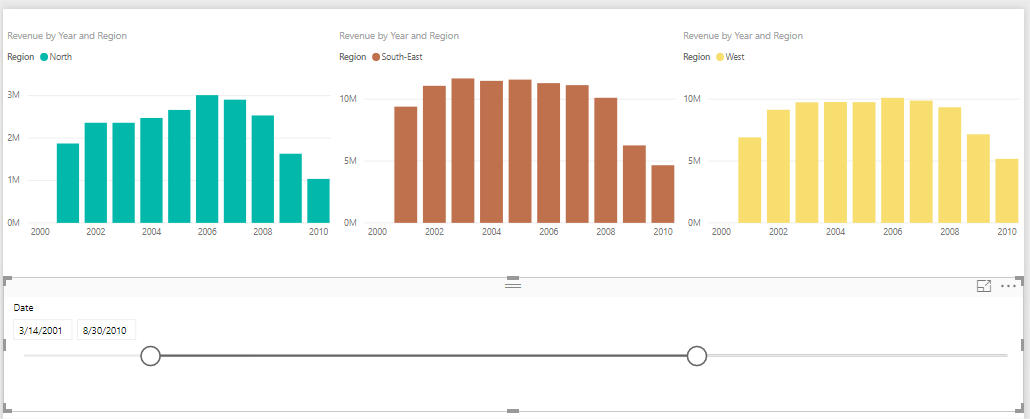
Now what if we want to put in a Date slicer and slice data for a specific time period only? As we can see, we have three Date columns:
If we put the Date column from the first table and then move starting and ending side of the slicer, we will have the following situation:
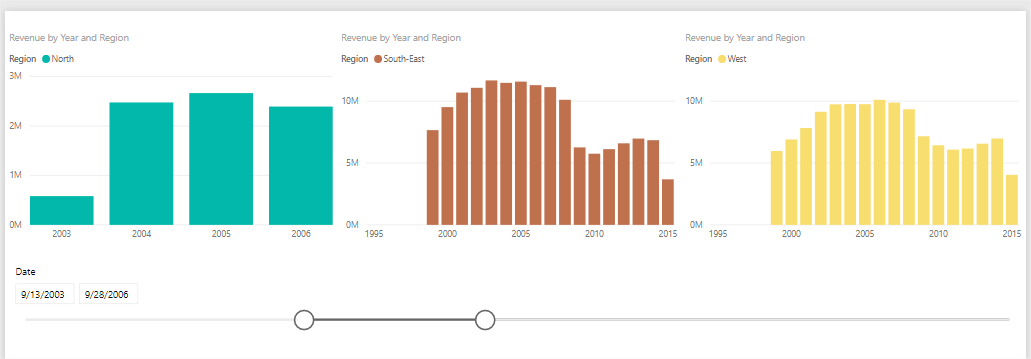
We see that the Date slicer filtered only the first visual, the other two remained unchanged.
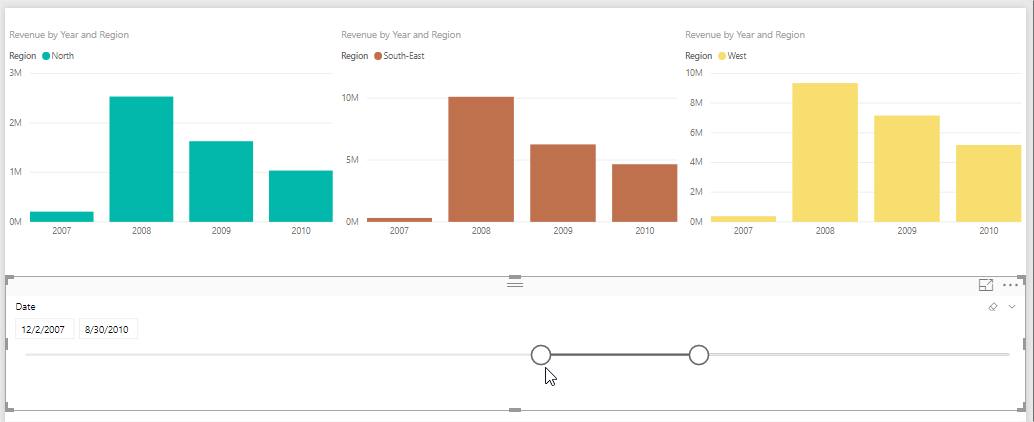
If we remove the date from the first table, and use the date from the second one, we will have following situation:
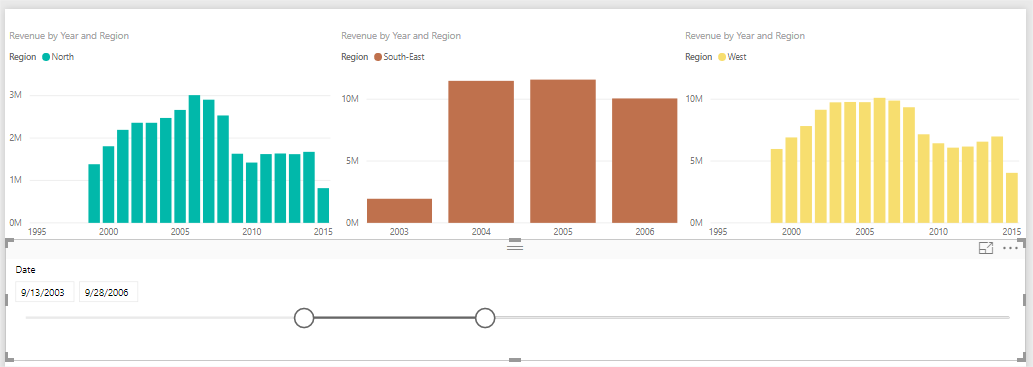
Now the second visual is updated, and the first one is back to its original shape.
We can guess for sure that the similar situation will happen if we take the Date column from the third table, the first two visual will reset to their original shape, and only the third one will represent data for the selected range in the slicer.
What if we want to slice all the visuals at once? Is it possible to use a slicer that will show the data in all three visuals for the selected date range?
This is possible, and we will work now in our model to make this happen.
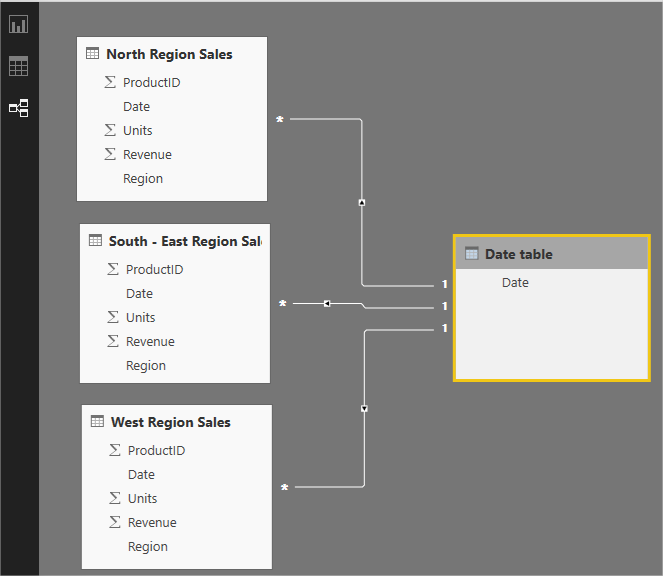
If we check the relationship tab, we see that there is no relationship between the tables in our model, and now we will create a table that will enable this relationship.
We will create a table, that will have a Date column as a key, and this will serve as a column to relate all three Date columns to it.
To create this table, we will use CALENDARAUTO function.
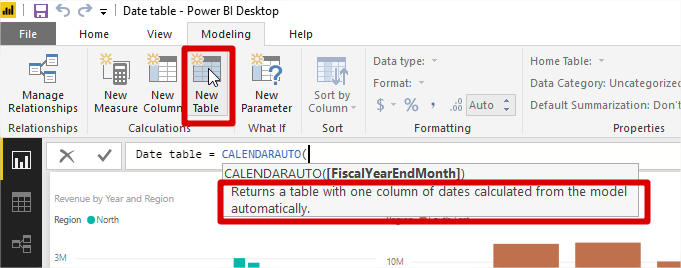
As we can see, this function returns a table with one column of dates calculated from the model automatically. The first row in this table will be 1 Jan of the year with the oldest date in our model, and the last row of this table will be 31 Dec of the year with the newest date in our model. We can see this in the following image:
Because the Dates in this table are unique, we will be able to create the 1-to-many relationships with our existing tables. We go to the Relationship tab, and create relations like this:
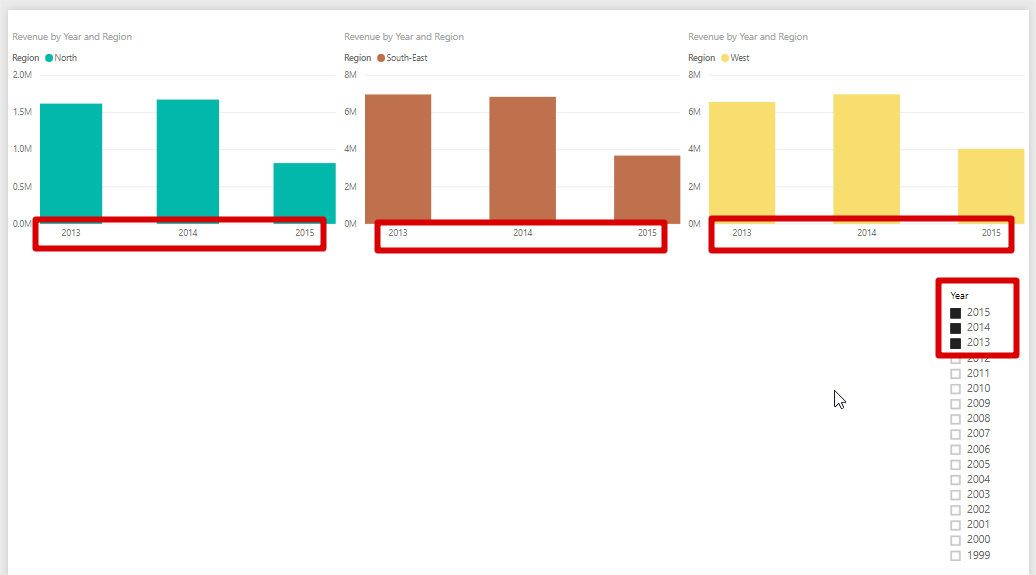
Now we are set to use the Date column from the Date table in the slicer:
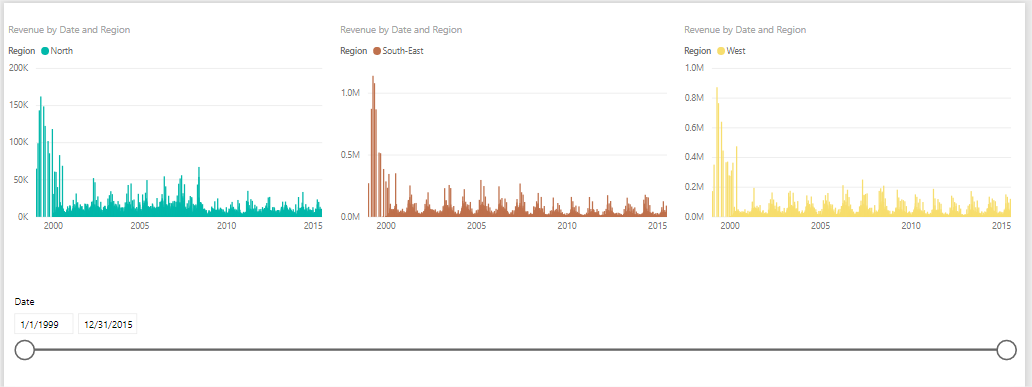
We need to replace the Date columns used in the visuals, with the one from the Date table. After we replace them, we will have the desired outcome:
We see that by using one slicer we can filter the visuals that come from three different tables.
Of course, we can add more columns in our Date table, for example:
Year = year (‘Date table'[Date])
Month Number = month (‘Date table'[Date])
Month = format (‘Date table'[Date],”mmmm”)
These columns will filter the data from our three Sales tables, just like the Date column did:
As a conclusion, we must always add a date time in our model containing more than one table with date columns to be able to create relationship between tables and to slice data in an easy way.