If you are looking for a Business Intelligence tool to meet your project requirement, but still feel unsure which one to choose so that it ticks the maximum number of items in your checklist but still does not hit your pocket hard. Then, the following blog is for you. In this blog, we will be focusing on the features of the two main leaders in the Business Intelligence domain, i.e. Power BI and Tableau.
We have seen on numerous occasions that the firms opted for Power BI over Tableau for a business requirement implementation and vice-versa. But if they would have opted for the other option, the firms could have extracted maximum value out of their investment. It does not mean that Power BI is superior to Tableau or Vice-Versa. But both of the offerings are great in their respective dimension but which one suit your requirement depends entirely on your use case and budget.
Overview
Let’s start with the overview of the senior player in the game. Tableau has been in the business for more than 10 years and this vast experience do showcase in the product. Tableau offers a variety of BI tools which can be exploited to enhance the data visualization. Tableau offers a vast range of visualization options, easy to use user interface and highly intuitive interactivity in the reports. The initial versions of the tableau were designed for creating interactive dashboards. But the product has evolved a lot over time to incorporate various out-of-box features. The interface to create visual is so easy that you can just drag and drop the metrics and visual is ready. Also, more frameworks have evolved over time such as SharePoint. Tableau lets you embed your report with ease into the new frameworks.
Now let’s have a look on the new player in the game. Power BI is a cloud based business intelligence platform. It is offered in the form of SaaS (Software as a Service). Even after being a new entry in the picture, Power BI has covered lot of ground on tableau and is continuously increasing its market share. It offers data discovery, data preparation and creation of dashboards in the suite. It lets you connect to almost all types of data sources and create scalable dashboards by mere drag and drop. Power BI is from the house of giant Microsoft and comes with biggest advantage that is exhibits wonderful support to Microsoft stack and thus easier integration.
Main differentiating factors
Pricing Model: How hard it hits your pocket!!
Price of the product always acts as a game changer because when firms purchase a product they need to take into account how long are they are going to stay with the product and hence, how much they need to pay from time to time. Overall, the main aspect is to identify that how much will each product cost to your business. The pricing strategy of the both the product is quite different.
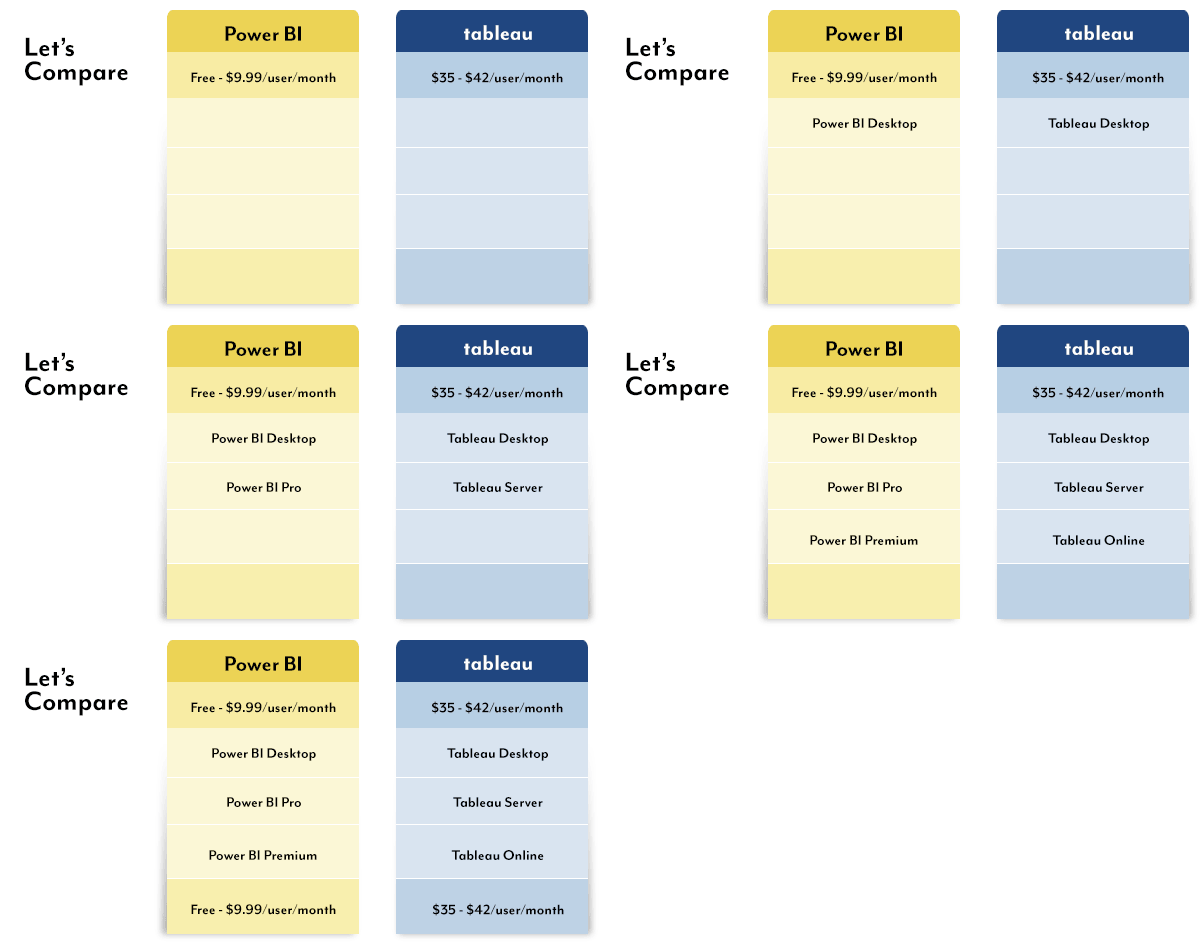
As already mentioned, Power BI is a cloud based business intelligent solution and is offered as a SaaS (Software as a Service) and thus, the pricing strategy seems to be quite analogous with the product. Basically, it comes with two primary pricing models:
- Power BI Desktop: Free
- There is a data cap of 1 GB
- Supports integration with few data sources mainly excel, CSV and others
- Dashboard and Report creation
- Publishing but only to web
- Power BI Pro: $9.99/user/month
- No data cap. It comprises of all available Power BI features
- Integration capabilities with wide range of data sources
- Proper access and authorization control
- Support for usage of on-premise data with the help of Data Connectivity Gateways
- Power BI Premium:
- It is a customized offering where the user opts for required features and the pricing is derived accordingly. In this offering, licenses are not required for individuals.
On the other hand, Tableau categorizes its products differently and offers in three different flavors, desktop, server and online server.
- Tableau Desktop:
- Personal Edition: $35/user/month
- Supports visualizations and dashboard creation
- Integrate with different type of data sources
- Professional Edition: $70/user/month
- All the features of Personal edition
- Integration capabilities with wide range of data sources
- Publish support to server and Tableau online
- Personal Edition: $35/user/month
- Tableau Server:
- On-premise or Cloud: $35/user/month
- Supports visuals/ analytics on all browsers and mobile device
- Central management of data sources
- Deploy either On-Premise or on Cloud with Amazon Web Services, Azure or Google cloud.
- Tableau Online:
- Fully Hosted: $42/user/month
- It is the fully managed offering of Tableau where Tableau takes complete onus of maintenance, upgrades and security.
- Supports visuals/ analytics on all browsers and mobile device
- Central management of data sources
- Fully Hosted: $42/user/month
- On-premise or Cloud: $35/user/month
Tableau Online is the equivalent of Power BI Pro edition and it can be easily noticed that you need to pay $42 for Tableau Online when compared to $9.99. Tableau comes with a rigid pricing model and indeed a hefty one on the pocket whereas the Power BI, since it is a cloud based solution, comes with a flexible pricing model which changes on the basis of usage and number of users. So, it can be easily concluded that Power BI emerges as a clear winner when it comes to pricing.
User Interface: How much skilled your end users need to be?
One major aspect to consider is how much easy is to use the interface? If the product is presented to the end users who may be a technical person or can even be a business person, the concern is how much time and effort it takes to start the ball rolling? If the answer is right from the word go, then the product will be fun to work with and not the one where the users are scared to do the task themselves and pass the task to peers.
Power BI comes from the house of Microsoft and as usual, the look and feel of the tool seems too familiar with the rest of the products of the Microsoft stack, specifically most with excel. Microsoft has put in a lot of its designer and UX skills to keep it intuitive to the maximum extent.
Tableau on the other hand, has been in the domain for over a decade and has always been one of the frontrunners in the domain. The reason being, the product has evolved a lot over the decade and tableau has done its best to keep it as simpler as possible. But if you are aiming for stars, meaning if you are planning for intensive reports or marks menu for example, it is not that intuitive and will require good time to master.
How well can you visualize and dig deep within data?
The primary responsibility of any complete Business Intelligence solution is to allow users to analyze the data in-depth quick enough to extract the insights out of it. Also, it should be capable enough to present the end result in a visually appealing manner.
In this regard too, the behavior of both the tools is quite disparate. Tableau focuses more on the front end whereas the Power BI penetrates well enough to give better insights out of data. Tableau provides a vast range of options in visualizations and has no doubt the best visualization in business. But the case is complete opposite in Power BI. Power BI first lets you manipulate the data, and then perform visualization later on it. Also, toggling data in visualization is comparatively way easy in Tableau compared to its counterpart.
When it comes to depth of data analysis, Power BI emerges as a clear cut winner. Power BI lets you analyze data sets in a faster manner and an enrich functionality to create relationships between data sources. Therefore, users can manipulate the data in a simpler way as they could do it in Excel which fell well short in the case of analyzing the data. Tableau lags in this aspect of data analysis. On a nutshell, Power BI shows good promise when employed for predictive modeling and optimization. Also, being a Microsoft product it enjoys the luxury of business analytics from platforms such as SQL Server Analysis services, Azure Machine learning and other Azure related databases as well.
How scattered are your data sources?
You also need to consider the factor that you need to consume data from which all data sources. If you are on an existing platform and you need to ensure that the new product has the capability to import the data from the existing data source.
Power BI is a Microsoft offering, so it is bound to have a soft corner for Microsoft owned platforms. It can easily integrate with Office 365 suite and the office application such as Excel, Access, etc. You can easily integrate with popular platforms such as SharePoint, Sales Force and others. Also, it has got a customization option where in you can hide or show portions of data, basically a way to selectively share the data. But such customizations are missing from Tableau. Tableau can too integrate with most common platforms such as SharePoint and others but integration with MS Office is still missing from its arsenal.
Custom Visualization or Out-of-Box support
For any BI or a reporting solution, it is inevitable that you might end up in getting a requirement to show data in a way not natively supported by the product. You might need to create some custom visualization or components that can display data in a more appropriate way.
Power BI lets you create your own custom visualization to support some out of box requirements. Also, you can find a lot many custom visuals provided by Microsoft or even open community. You can download them and use in your reports. On the other hand, Tableau provides with a huge list of visuals, but if you end up in having a peculiar requirement, then you are out of luck here. Tableau does not provide support for custom visuals at the moment.
Conclusion
Here is a glimpse of summary of the comparison:
| Feature | Power BI | Tableau |
| Available Since | 2013 | 2003 ( A seasoned campaigner) |
| Visualization | Provides decent visualization support but less when compared to Tableau | Provides a wide range of visualizations ranging from basic ones to complex ones |
| Environment | Power BI Desktop runs on windows platform only but can run with restricted features on other platforms as well | Runs on both Windows and Mac |
| Pricing Strategy | Flexible and way economical when compared against peers | Rigid and is quite expensive when compared with Power BI |
| Learning Required | For naïve usage, no explicit learning is required. But if you are planning to perform complex calculations, then you need to be well versed with DAX, a Microsoft proprietary language | It is quite straightforward to use. It takes some time to get accustomed with the interface but no explicit learning required as in Power BI. |
| Built-in Charts formats | Supports a good number of charts and bars | Supports a vast range of charts and bars, better in quantity than peers. |
| Custom components | Can be created and good community support | Close ended. No option to create custom components |
| Limited Data Points | Power BI places a limitation that a chart can have a maximum of 3500 data points. So it leads to a possibility of omitting out outliers | No such limitation in tableau. |
| Data Discovery depth | Better data discovery depth as it is done at backend | Limited data discovery depth. |
| Forecasting | No support for forecasting | Excellent support for forecasting |
| Integration support | Can be integrated with standard platforms and MS office 365 suite as well. | Integration compatibility with standard platforms but missing integration support with office. |
You have seen the features and differentiating factors of both. There is no clear cut winner as such. For an economical resource with good visualization capabilities, then you can go ahead with Power BI. If your requirement is of high end visualization and budget is not a concern, then you opt for Tableau.


